
Eye of the Storm, Groupwork
Groupmates: Brittany Giunchigliani, Chelsea Kashan, Jennifer Horowitz, Indrajeet
Haldar
Final Project for SCI:6322, Mapping, Represntation and Speculation at the GSD, Harvard
University
Commendation
by the British Geographical Socitey for the Bartholomew awards
ArcGISro, Photoshop and Unity
Introduction
Data, numeric or otherwise, is morphed by who is presenting it. In this case, when we examine hurricanes. Our project was divided into two phases during which we explored how to create the maps that document hurricanes and looked at various methods of digital representation to tease out the arguments we wanted to present – that of the positionality of the mapper affecting the final presentation in the form of a “map”.
Phase 1
Phase one deals with a series of visuals we called the Luminescent Hurricanes. Here we look at the first set of maps that provides a more global perspective on hurricanes across the earth’s surface, focusing on illustrating their motion in an illuminated global perspective (Map 1A). (Maps created by Brittany Chelsea and Jennifer)
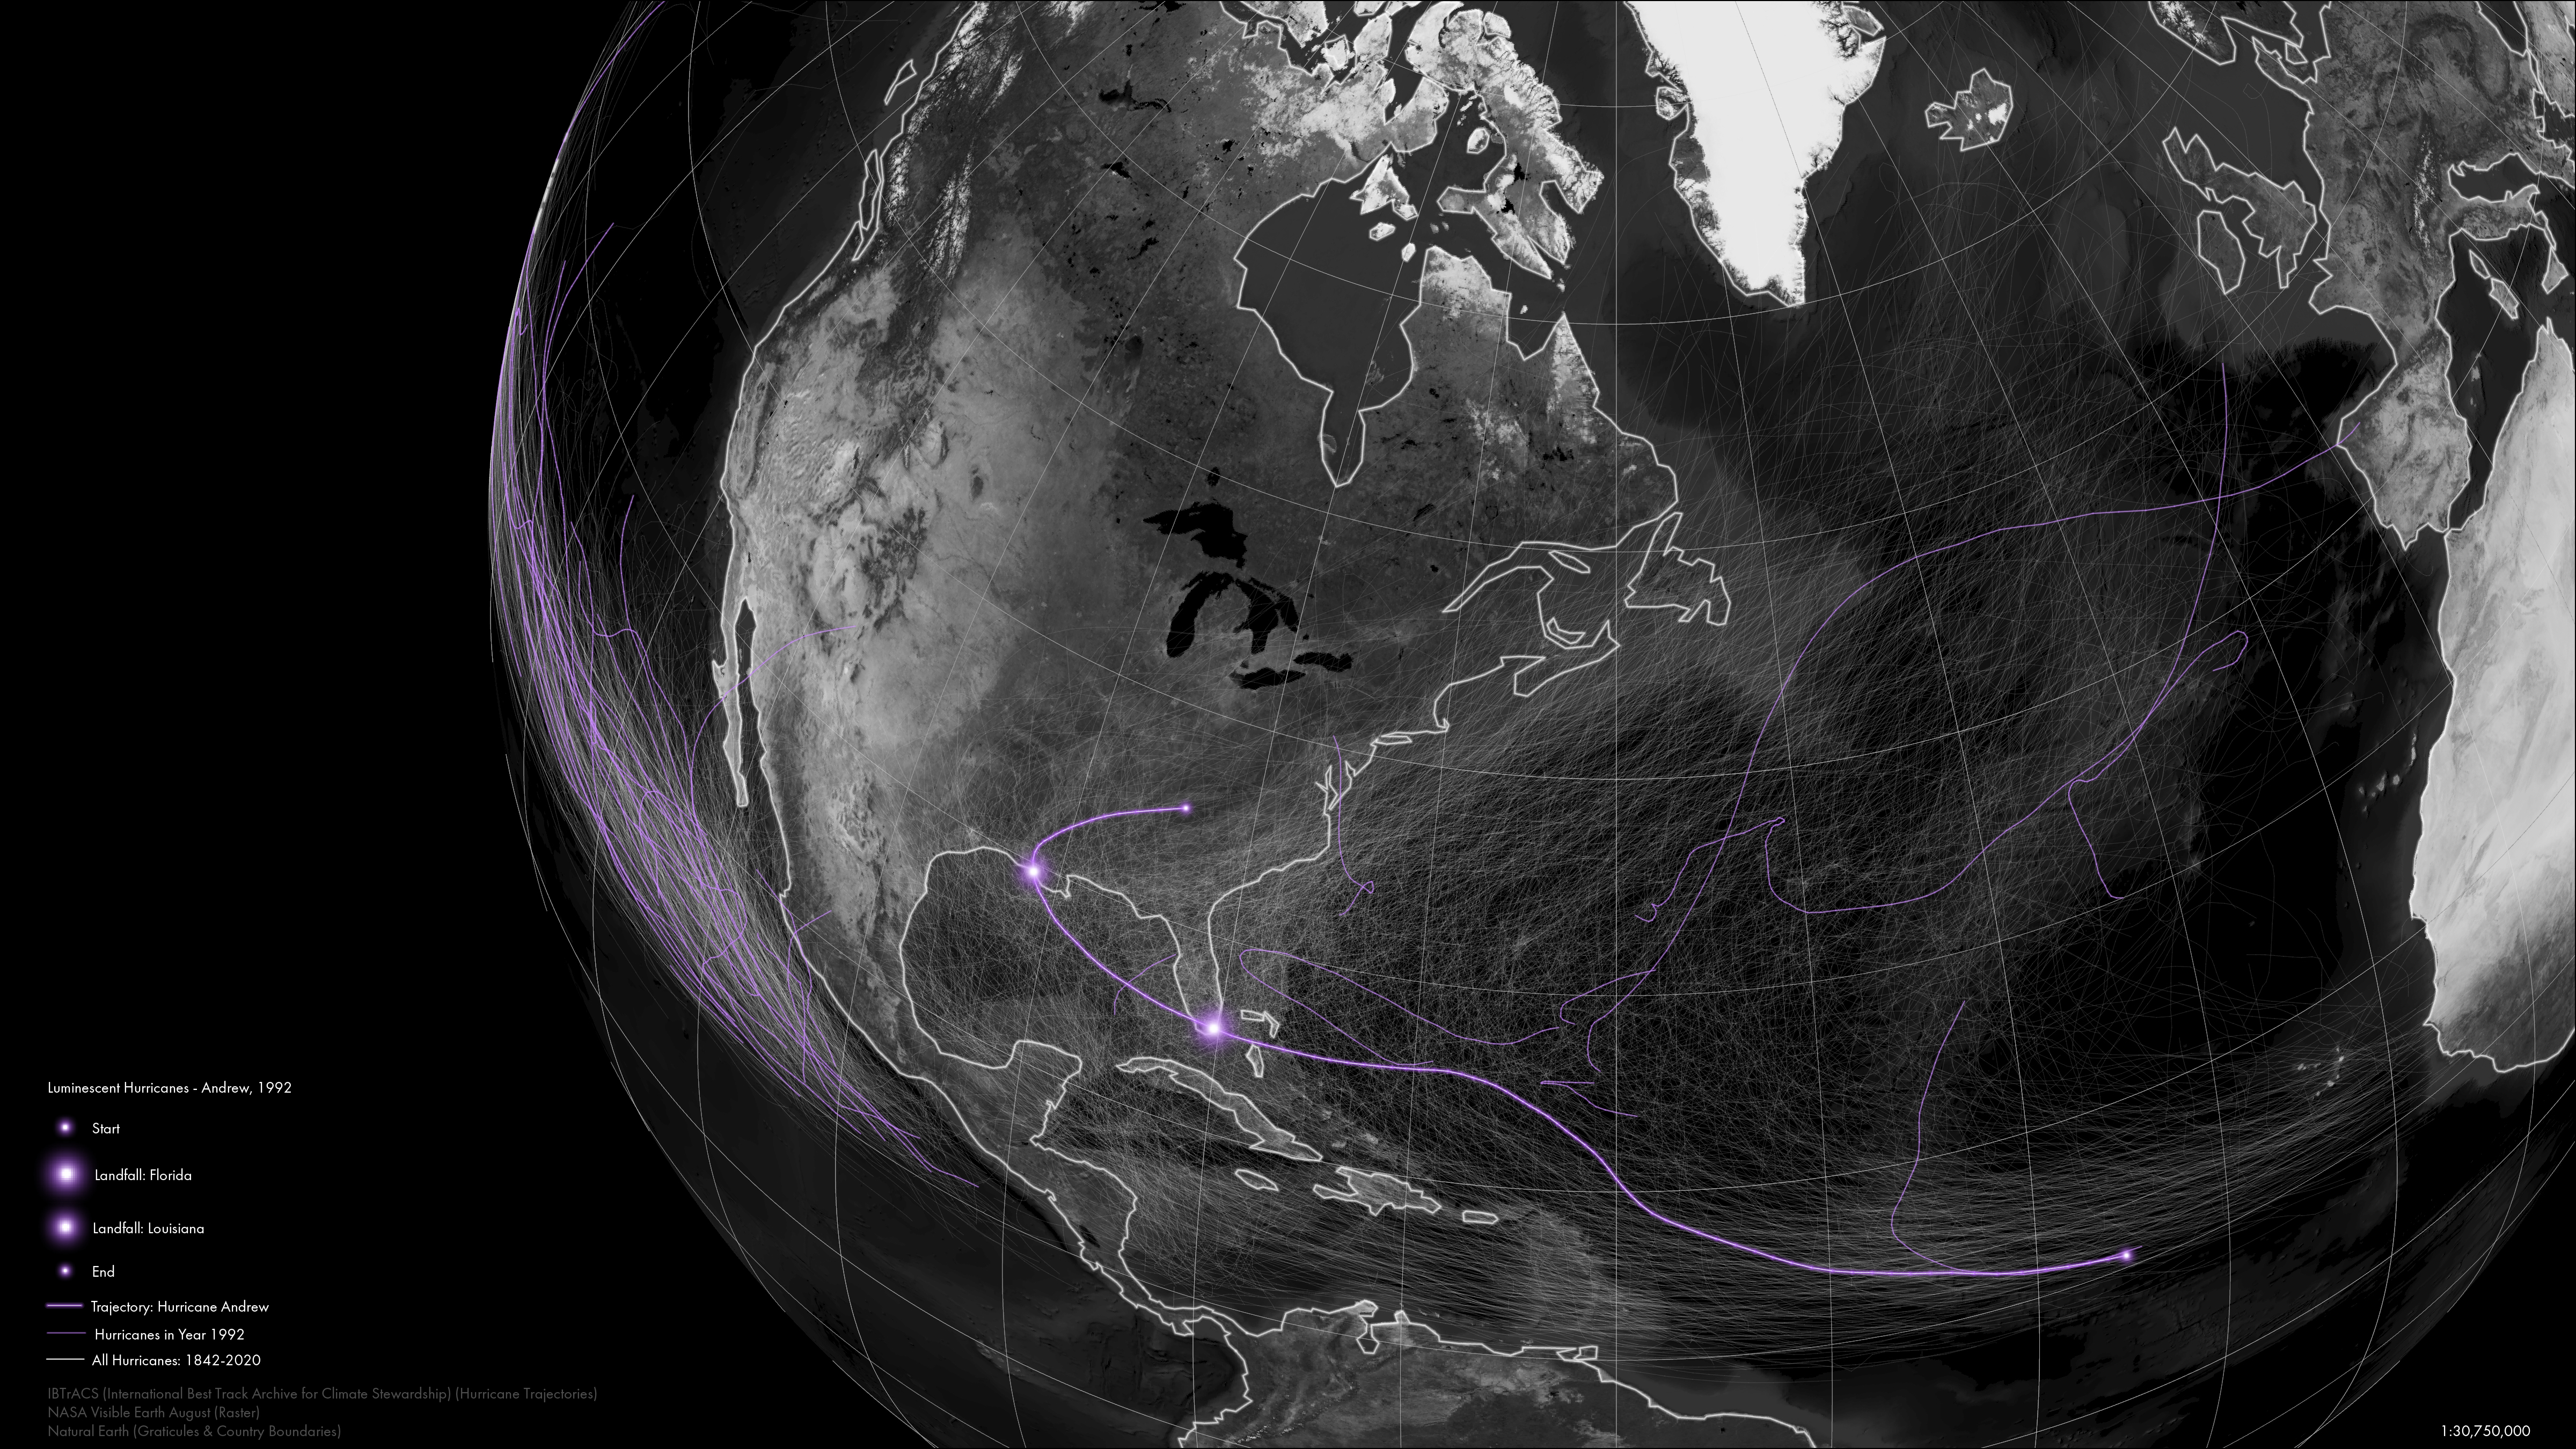
Later, we try to break away from this notion of traditional mapping and create an interactive visualization applying the Doppler effect to develop to illustrate the anticipation created through the hurricane’s movement. By using wind speed and barometric pressure values transformed to mathematically parallel tonal values as the historical trajectory of Hurricane Andrew builds and moves its way from sea to land (Map 1B). (Maps created by Jennifer and Indrajeet)
Experience the map yourself !
Phase 2
In the second phase, we intended to explore the idea of positionality even further. For this purpose, we created a set of maps; the first is a record of the news data that broke with the storm. This is a cartographic animation of archival hurricane news coverage from 1955-2005 overlaid with the vibrant green trajectory lines of major hurricanes (colorized to reflect the ‘green lightning’ that occurs when hurricanes hit transformers) as the storms make their destructive path across the Florida panhandle.(Map created by Jennifer)
Next, we looked at how the data is documented (Seeing Eye-to-Eye: NOAA Hurricane Hunters). This videographic map unpacks Hurricane Katrina’s track through the lens of NOAA Hurricane hunters. The frame mimics that of a display on a flight, and acts as a moving buffer around the track line, all the while displaying the names and tasks performed by each NOAA ‘hunter hunter’ flight crew member. (Map created by Chelsea)
After which, we examine a historical record of a hurricane (She Went Thataway: Unpacking Hurricane Donna). This map unpacks the magnitudes of data embedded within the mapped line of Hurricane Donna in the south Florida coast circa 1960. Archival, seemingly empirical documents are slowly revealed together with the more ‘rigid’, and seemingly objective GIS layers appear on the map. (Map created by Brittany)
Lastly, our intent was to tease out the argument that there were certain unmeasurable features and wrote our own dithered shader algorithm to indicate the impermanent but authentic aspect of memory. This interactive, immersive experience is set in Harvard GSD student and data visualization team member Chelsea Kashan’s childhood room in Miami, Florida. In this interactive visualization, the viewer steps into Chelsea’s shoes and walks around her room, bracing for Hurricane Katrina to hit. Using memory and data together as a guide, one sees glow in the dark stars on the ceiling, the orientation of the bed, the dimensions of the window--through this interactive virtual reality. The memories of hurricanes past (the last three maps) are projected onto her bedroom walls. All the while, flashes of green light appear through the window as transformers give out, while the endless news coverage of the approaching storm is seen from the small TV in her room. This place acts as a portal into the lived experience of the hurricane – the qualitative, the unmeasurable. (Map created by Indrajeet)
Experience the room yourself !
