
Predicting the 2020 US Elections, Groupwork
Groupmates: Tyler Piazza, Charu Srivastava, Salmi Shide
Final Project for CS:109A at FAS, Harvard University
Python, Libraries used: sklearn, pandas, geopandas, seaborn and matplotlib
Introduction
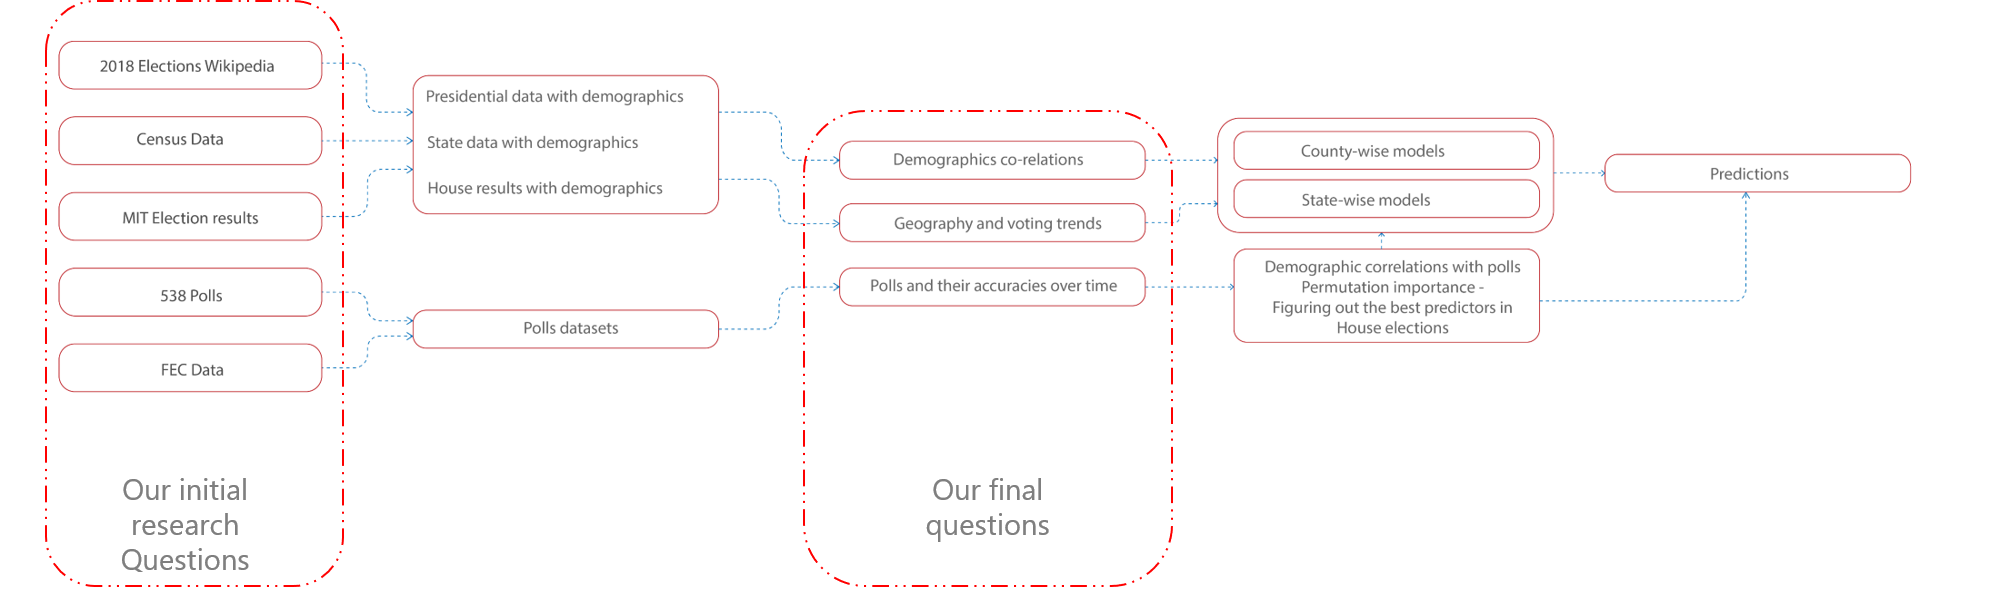
The goal of this project is to build a model that can predict the results of the 2020 presidential, senate and house elections. To do this, our team worked with multiple datasets that included data on past election voting results, polling results and demographic data at the county, state and national level. We collected results for the presidential, senate and house elections from the years 1976-2016 and Census data for the years 2000 and 2010.
Methodology
We scraped several websites to get data on election voting results, polling results and demographic and Census information. We used websites and open source databases such as Federal Election Commission, MIT Election Data + Science Lab and Wikipedia for election results. We also used 538 for poll data and Census.gov for demographic and geo-spatial data.
Explorator Data Analysis
For the EDA, we used our curated datasets, in addition to the 2020 poll results, geospatial data and presidential election results dataset to better understand the available data.
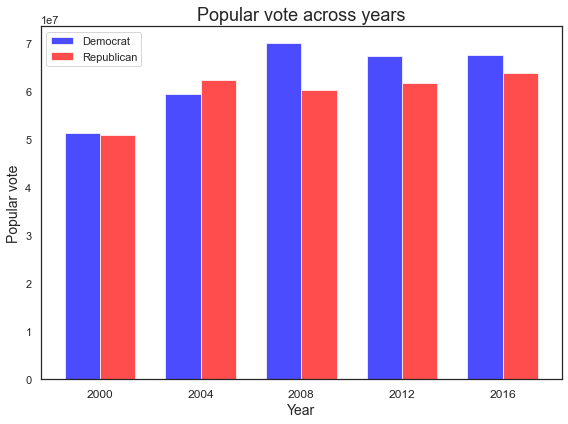
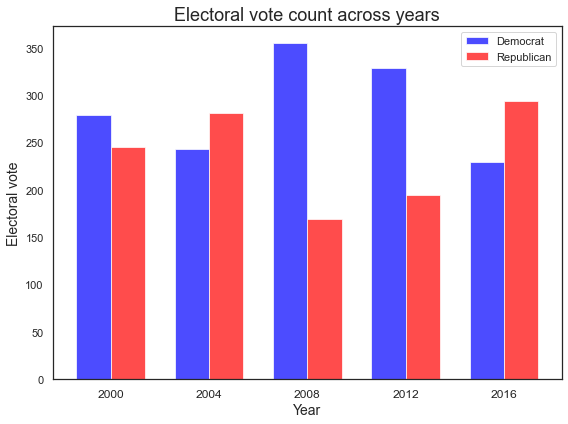
The plots below show the total popular vote (left) and electoral vote count (right) nationally for each election year (2000-2016). The popular vote, based on total number of candidate votes across all counties, shows a clear Democratic lead in all years except 2004. The electoral vote was deduced by finding the winning party for each state and adding up the corresponding number of electoral votes.
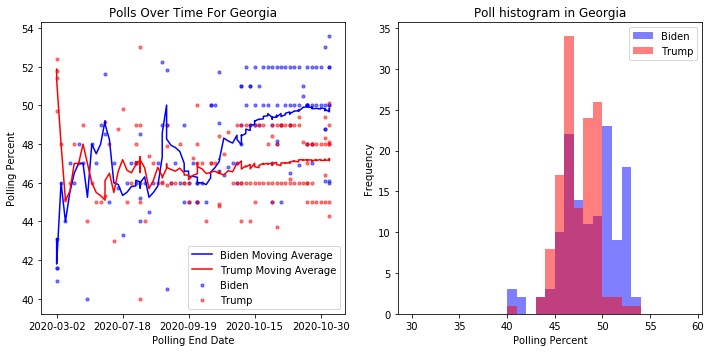
The plots below show 538 Poll data for Biden vs. Trump in the now-blue state of Georgia. The histogram (right) shows that when looking at 2020 polls, Biden has a sizeable number of large (greater than 50%) poll values, but the timeseries rolling averages (left) illustrate that this lead took place starting in September. Beforehand, the polls were far less conclusive
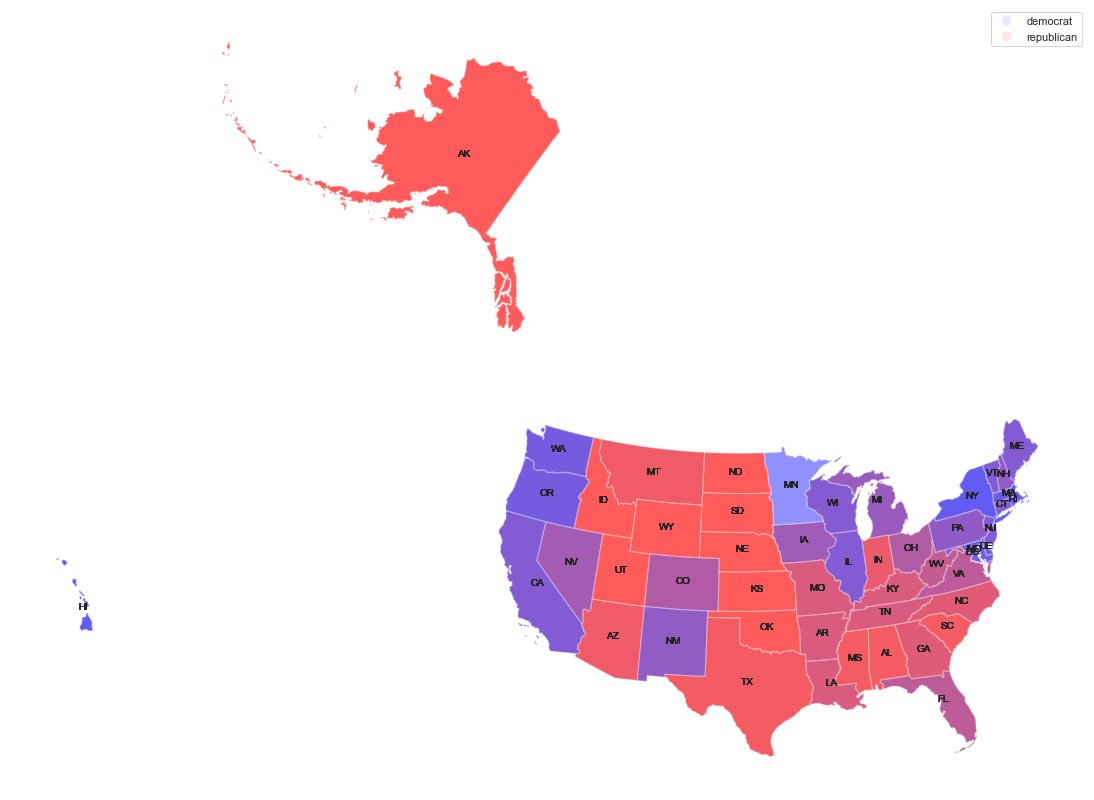
The figure below plots all the election results from 1976-2016. Interestingly, the states Idaho, Wyoming, South Dakota, North Dakota, Kansas, Oklahoma, Nebraska and Missouri have never voted blue, however all blue states have voted red at least once. This can be seen by the fact that some states are pure red, while none of the blue states are pure blue.
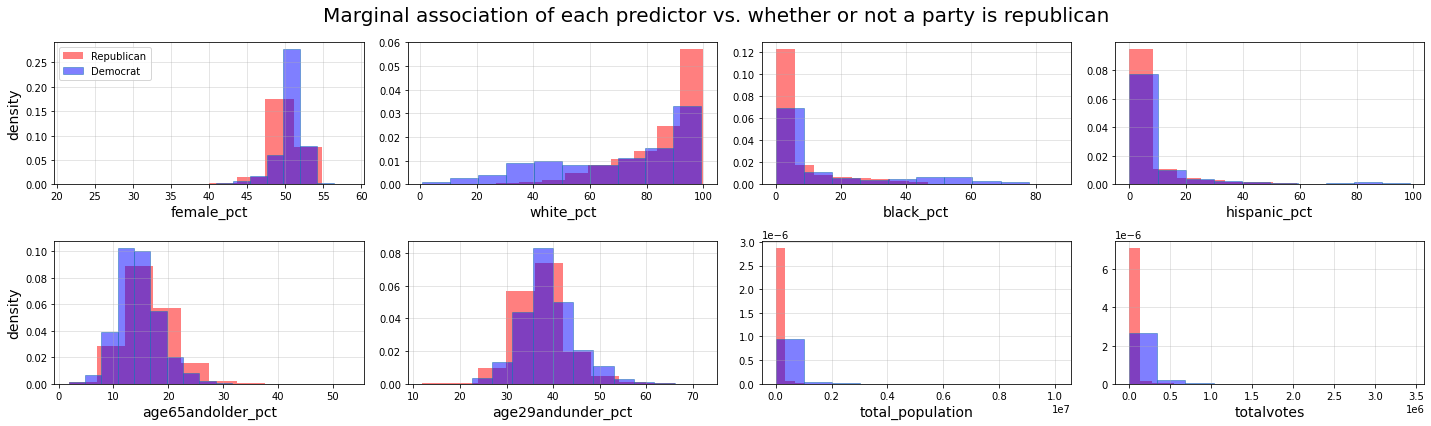
These histograms show the marginal association of our predictor variables based on the results of the logistic regression model.
Predictive Modelling
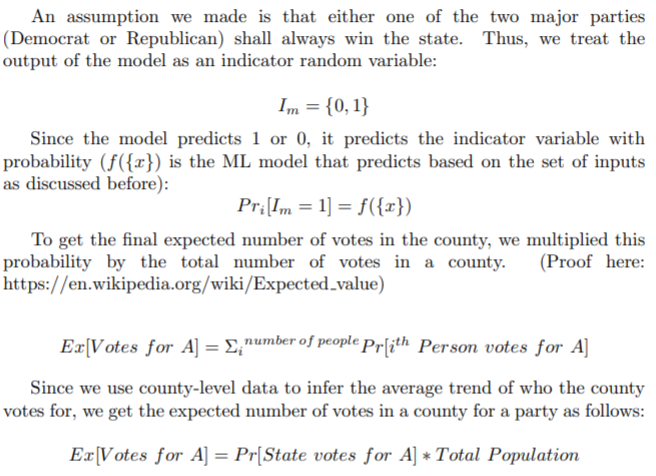
To predict which party will win the 2020 election, we used several classification models including logistic regression, decision trees, random forests, bagging and boosting. We split the data into train and test sets and made predictions for each model at both the county and state level and compared results to identify which is most accurate (the county level data is aggregated to create the state level dataset). Without getting into the weeds too much, here's the mechanism we used to come up with predictions from the ML model
Logistic Regression Models
We fit three logistic regression (LR) models using data at the county level: (1) a baseline model, (2) an LR model with lasso regularization and (3) an LR model with interaction terms. Although the interaction model had a slightly higher test accuracy (85.31%) than the lasso (85.02%) and baseline model (84.84%), because the difference was so small and the interaction model had so many features slowing down the run time considerably, we ended up using the lasso model for the rest of our analysis.
Decision Tree Models
In addition to the logistic regression model, we also fit a decision tree, random forest, bagging and boosting
model. The final parameters chosen for the single tree model was depth 4, while the bagging model used depth 5
and number of estimators = 215. At the county level, the random forest model performed the best, with test
accuracy (86.28%), while the accuracy of the other models was as follows: decision tree (85.79%), bagging
(85.91%), boosting (85.21%). Table 1 shows all the model accuracies.
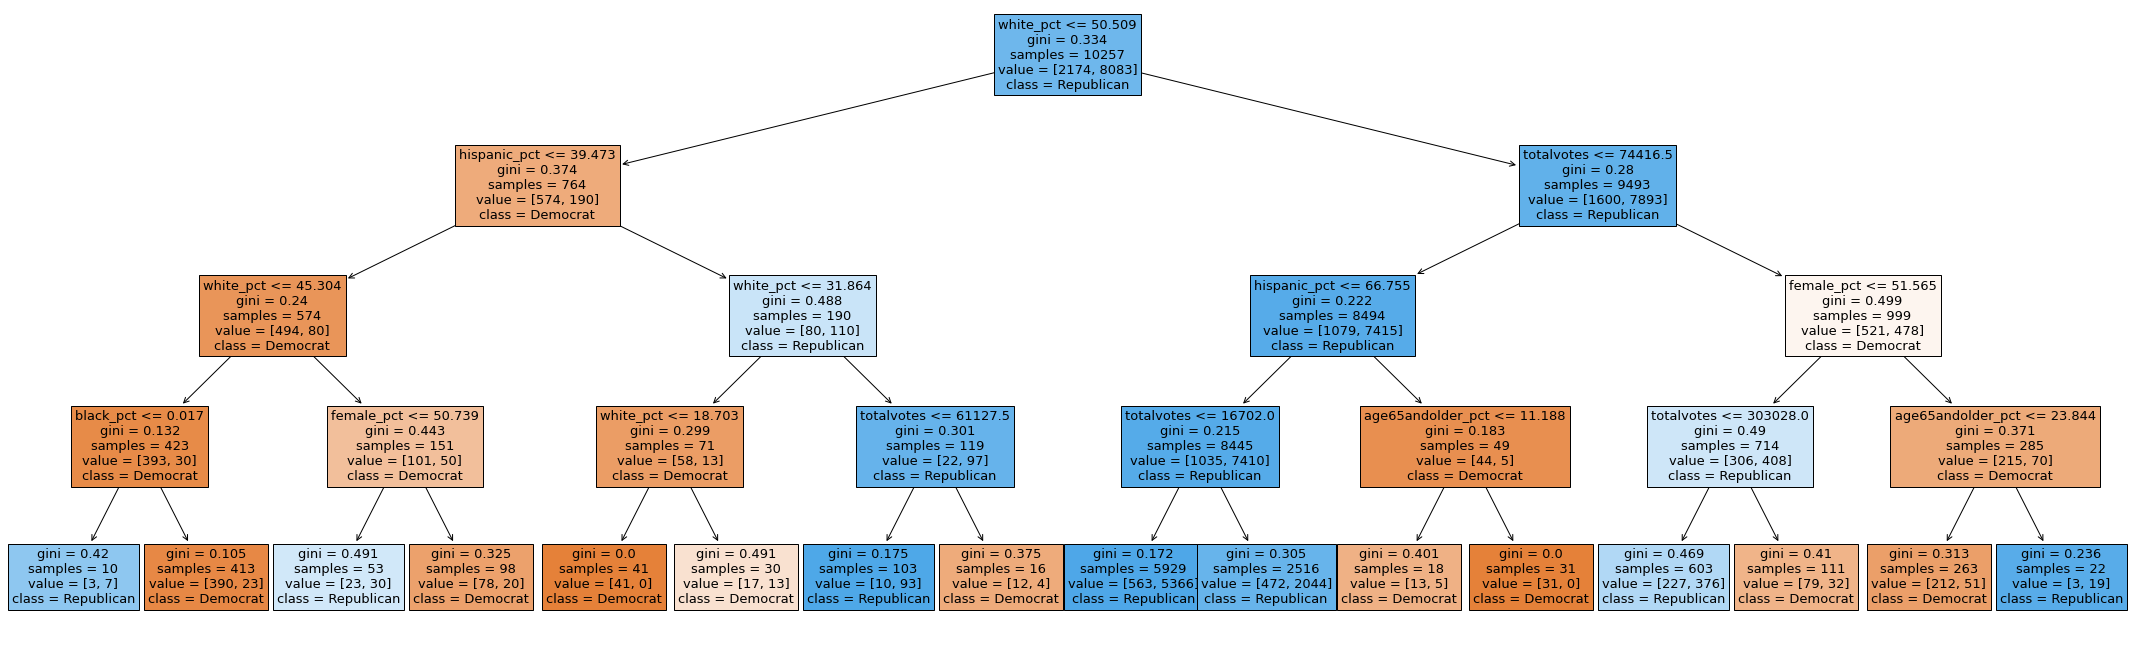
Surprisingly, the single decision tree
performed remarkably well, providing us with an easily interpretable flow chart. Our reasoning for this is that
the other ensemble models (bagging and boosting) bootstrap the data excessively and end up with many more
instances of Republican data (in some cases they maybe have no Democrat county data in the bootstrap) and thus
overfit on the Republican data.
At the county level, the important predictors of splitting were race (being
white or not), total number of votes and the population numbers and the age of the populous. The reasoning here
seems quite straight forward – counties with higher number of total votes are more likely to be major cities –
which are heavily Democrat leaning (confirming our hypothesis from the EDA). In the state-level prediction, the
split is slightly different. The model splits first on the under29 demographic and then black % and total number
of votes.
The final predictions
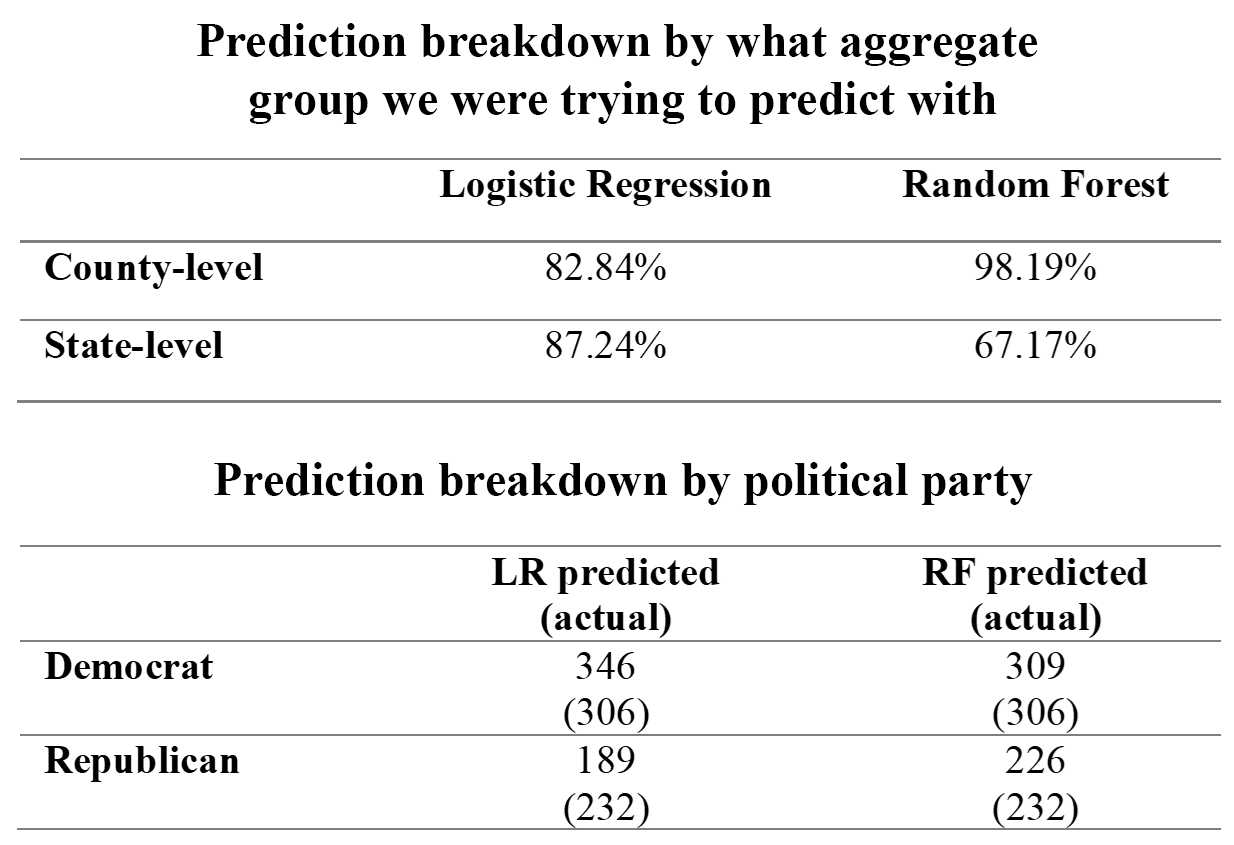
We did make eerily accurate predictions using the Random Forest model. The Logistic Regression model predicted the landslide which everyone spoke about.
Swing State Analysis
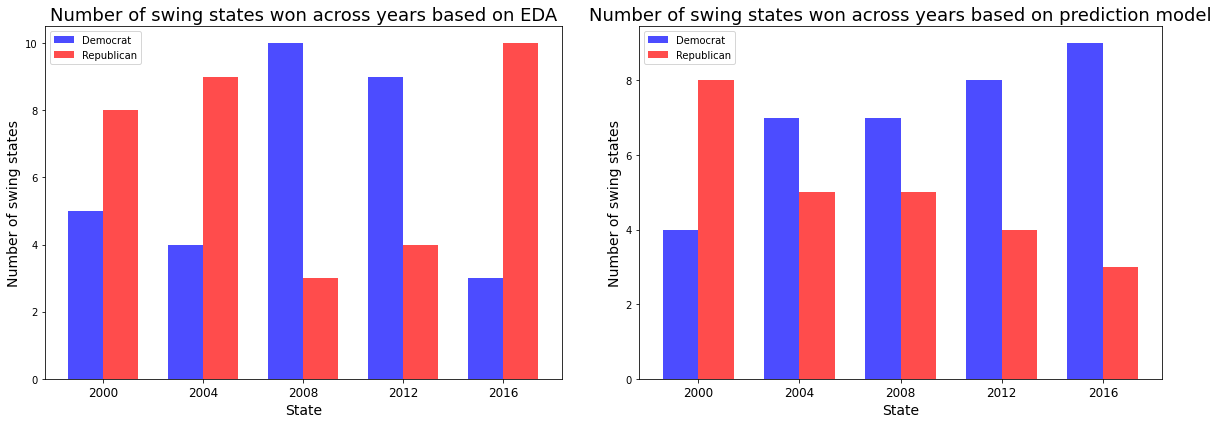
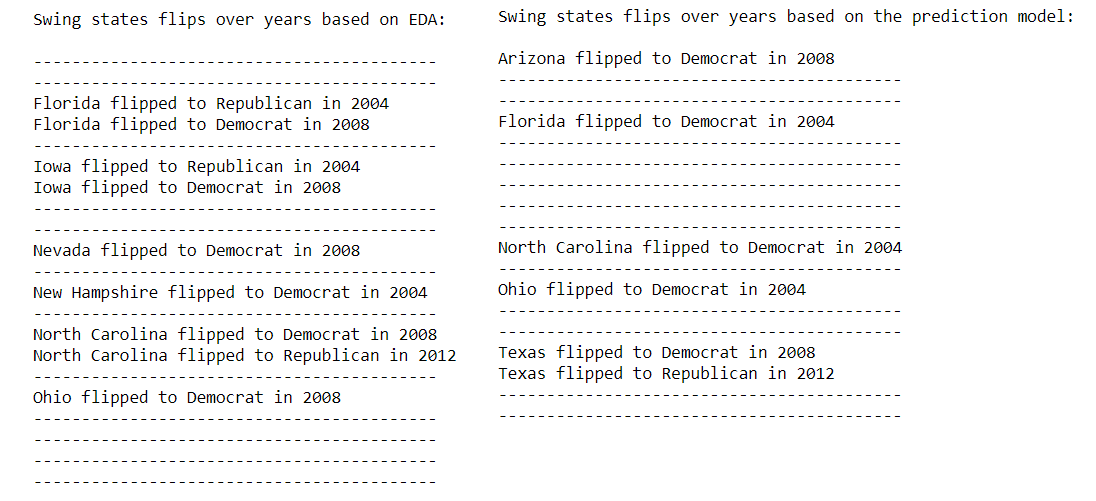
Our state-level logistic regression model did not perform as well in predicting the outcome of the election in our predefined swing states. Generally, our model predicted more states would vote Democrat, when in fact they voted Republican. Additionally, our model was unable to predict if and when a certain swing state would flip party lines, underscoring the difficulty in predicting how swing states will vote based on demographic data alone.
House, Senate, Polls
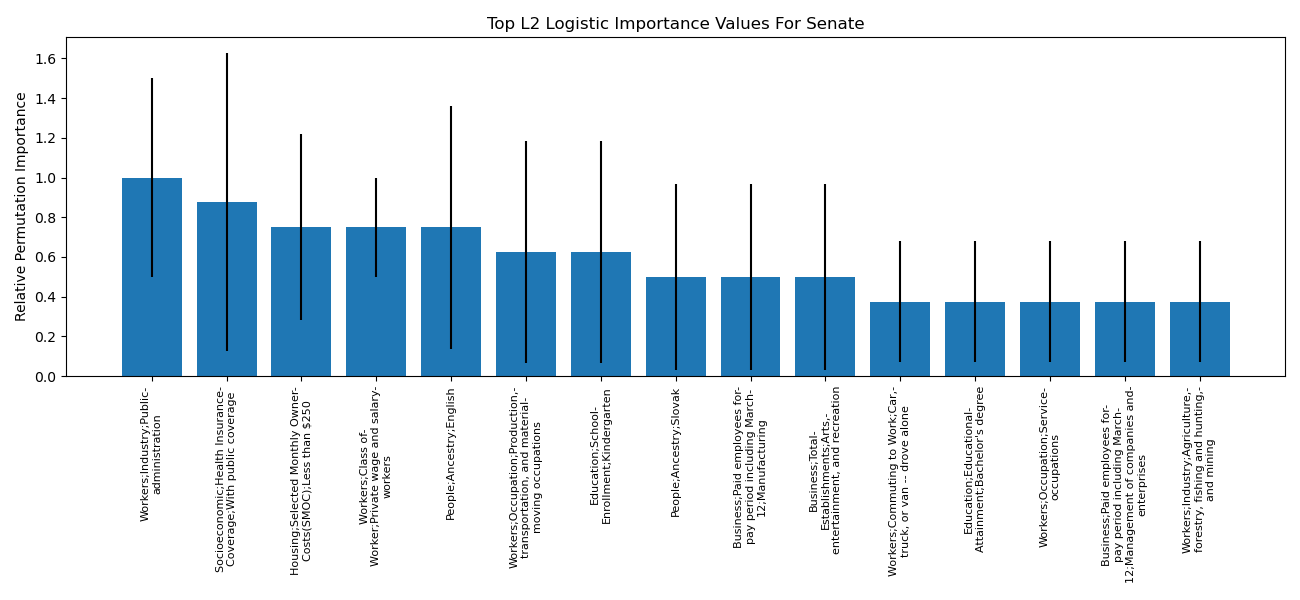
Takeaways from the Senate analysis was that the percent of people on healthcare in a state was an important feature (according to permutation importance and by being the largest coefficient of the model), with more people with healthcare positively linked with Democrat chances of winning the Senate seat. From the House analysis (where the corresponding permutation importance graph is not shown), elements focused on wealth were important, whether it was the number of finance/insurance companies in the district, the number of families below the poverty line, or the number of manufacturing jobs. The greater the number of families under the poverty line in a district, the greater the chances for Democrat House candidates.
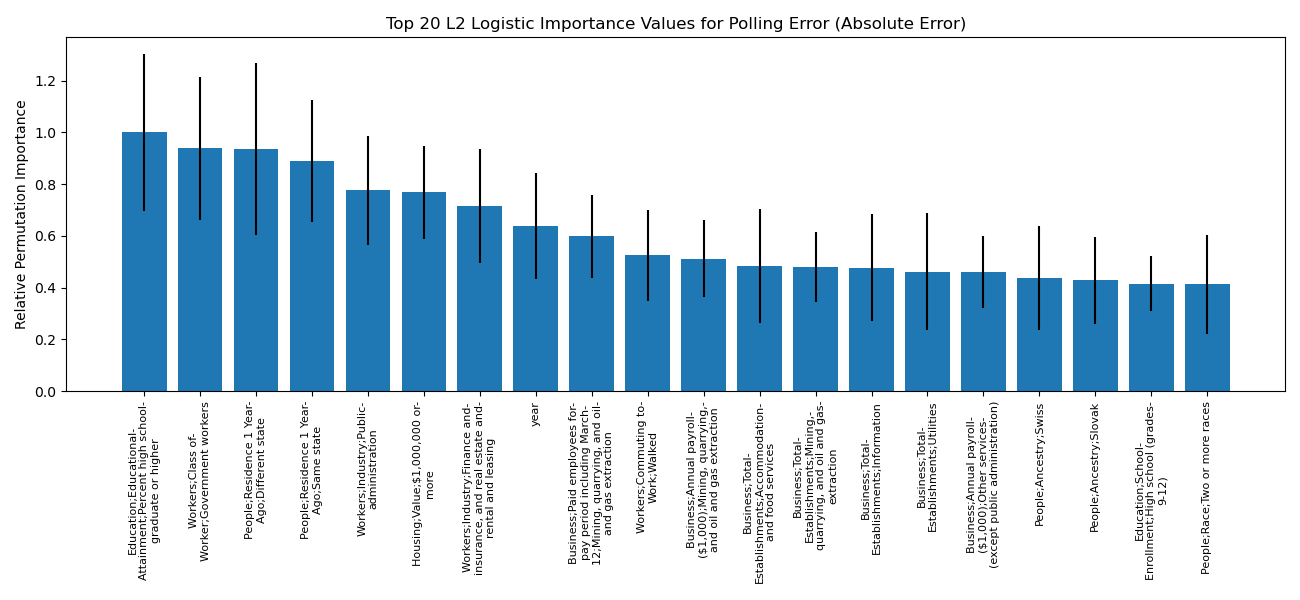
When we try to predict the absolute value of the polling error, the most valuable predictor (according to permutation importance and the model coefficient sizes) is the percent of high school degrees, where greater high school degree rates correspond to greater polling error. On the other hand, the more people that lived in the same state last year led to smaller polling error. When predicting polling error with direction, the year is an important feature (according to the permutation importance, and also according to the size of its coefficient in the model), with later years corresponding to overly optimistic polls for the Democrats – it is important to note that this result may just be a figment of the 2016 results. Similarly, the model coefficients and permutation importance demonstrate that a greater Latino and/or Mexican heritage in a state lead to the opposite issue with the polls, perhaps implying that Latinos are voting for Democrats in higher number than the polls suggest. It should also be mentioned that we analyzed using polls and demographics to predict past presidential statewide winners, and lo and behold, the polls delta (specifically, the democrat percentage minus the republican percentage) was the most important feature in predicting not only the winner of a state, but the margin itself. The best binary predictor achieved a test accuracy of 0.89 (compared to a baseline accuracy of 0.55). Besides the polls, important predictors were the year and the amount of Latino and/or Mexican heritage in a state (year is linked to Republican chances, Latino/Mexican percentage linked to Democrat chances).
Discussion
Both our logistic regression and random forest models correctly predicted the outcome of the 2020 presidential election and were compatible with what experts predicted. Our model predicted a higher margin of victory for Democrats, which is consistent with 2020 poll data. Our swing state analysis highlights the volatility and uncertainty associated with predicting election outcomes based on swing states alone. Ultimately, the voting results probably depend on a few counties within each state, which eventually “swing” the election in favor of one party over another. While the vast majority of the states are most likely to stick to voting either Democrat or Republican, it is challenging to make an accurate prediction in swing states. This is what makes the election so hard to predict! For senate results, the percentage of people on healthcare is an important predictor. Positively linking to Democrat senate wins, it connects to the reality that Democrats have been championing healthcare as a key part of their campaigning message in recent years. Similarly, the fact that greater levels of family poverty correspond to better chances for Democrat house wins, links to Democrat party messaging about income inequality and living wages. Looking at the polls, it is no surprise that the polls (more so than demographics on the ground) are the most important predictors of the presidential statewide winner. That said, the fact that the models still emphasized the percent of Latino and/or Mexican heritage in a state demonstrates that this population may vote for Democrats more than the polls suggest. When we consider polling error, we again see that Mexican and/or Latino heritage contributes to polling error in a similar direction, and the rate of high school graduates in a state is linked to absolute polling error.
Future Steps
In the future, for the random forest model, we would probably make two different models to predict the number of votes received by each party given demographic data. The probabilities of that model could better help us predict the elections and describe a margin of error term that we are currently missing. If we had more data, we would also explore making a custom neural net (perhaps a shallow one with less than 15 nodes per layer). Using our logistic regression model, we were able to predict how many times each swing state would vote Democrat vs Republican for the years 2000-2016. In some cases, the states flipped once and didn’t go back, but in other cases they flipped more than once. A great next step would be to find a way to better predict and visualize exactly when (and how many times) the states flip. A limitation of the demographic study with house races, senate races, and presidential polls was that the demographics were fixed to a decade, so they did not change year to year. Being able to use more time dependent information, if it exists, would allow for deeper analysis on the changing demographics of America. Additionally, because basic logistic or linear models were used for the sake of coefficient understanding, next steps would include using more complex models (like neural nets) to engineer features across the many input features. To improve the presidential prediction model, we would also want to investigate custom loss functions, so that electoral college votes and the closeness (in the polls) would be important in determining how much loss to assign incorrect probabilities.
Conclusion
We conclude that demographic data can be used to predict the results of presidential elections with a high degree of accuracy. However, they do not provide a comprehensive understanding of the voting demographics. The presidential election is an important event for a country and being able to model chances of winning in a particular state can be a useful tool in campaigning. During the campaigning process, candidates should ensure that voters are treated as individuals as opposed to groups. Our analysis sheds light on the usefulness of poll data in making election predictions as well. The polls are more accurate than just demographic data alone, however they do make errors that correlate with demographic information. Our analysis shows that demographic and poll data can indeed be used to make fairly accurate predictions for elections and that analytical tools and models can be leveraged for campaigning in future election cycles. More broadly, this kind of analysis can be applied to elections in other countries, depending on availability of data.